






Know what every database is doing, without a second console.
Infrastructure metrics on every database from day one, database-level performance insights when you need them, and native integrations into the monitoring and security tools your teams already run.
Trusted by enterprises at scale
leading-healthcare-data-platform
100% observability across all workloads
Fortune 250 Transportation Company
Real-time visibility across 500+ databases
Global Fortune 100 Energy Company
Connected to their existing monitoring stack
Database monitoring is scattered, shallow, and set up one database at a time.
Seeing that a database is busy is easy. Seeing which query, which wait, and which user is behind it, across the whole estate, is where the visibility gap lives.
Health lives in many tools.
CPU, memory, IOPS, and query load each sit behind a different screen. Building a picture of one database means checking several places, and building a picture of the estate means checking all of them.
The numbers say load is high, not why.
Utilization graphs show that a database is busy. They rarely show which SQL, which wait event, or which user is driving it, and that answer usually needs separate, specialist tooling.
Monitoring is set up one VM at a time.
Third-party agents are installed and configured per database by hand, so observability becomes its own project instead of something every database has from the start.Two layers of visibility, connected to the tools you already run.
Infrastructure health on every database from the moment it is provisioned, database-level insight when you need to go deeper, and native hooks into your existing stack. Here is what that looks like in practice.
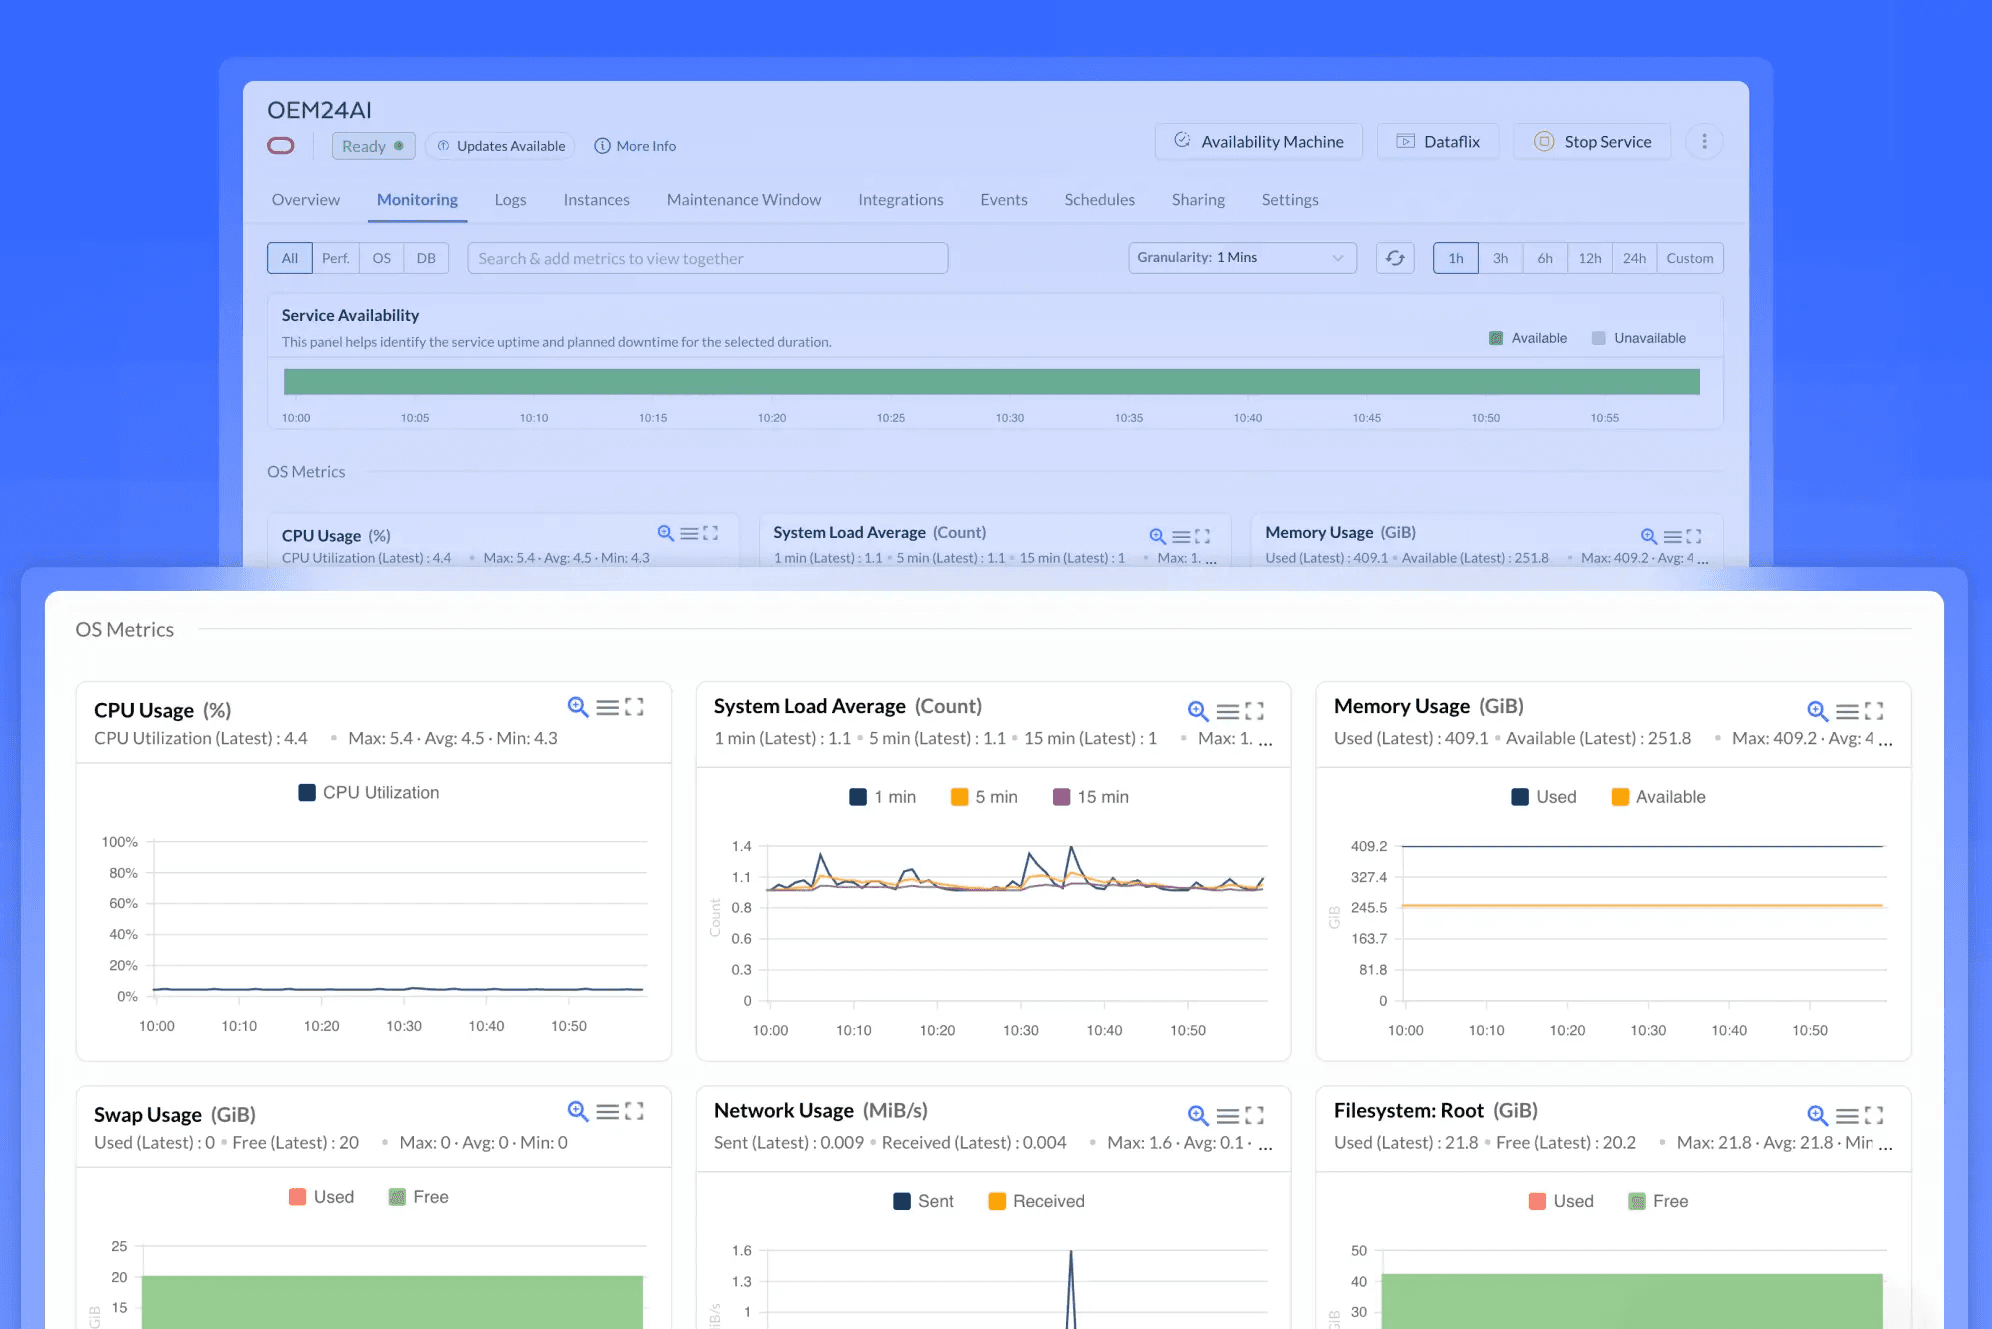
Infrastructure health, built into every database.
Every database service exposes its own OS and infrastructure metrics from the moment it is provisioned, with no agent to install. CPU, system load average, memory, swap, network, filesystem usage, disk throughput, and IOPS, plus the top processes by CPU and memory, all on the service page. Metrics refresh every 10 minutes, with 5-minute granularity when you zoom in.
Real-time visibility into performance, compliance, and utilization across more than 500 databases.
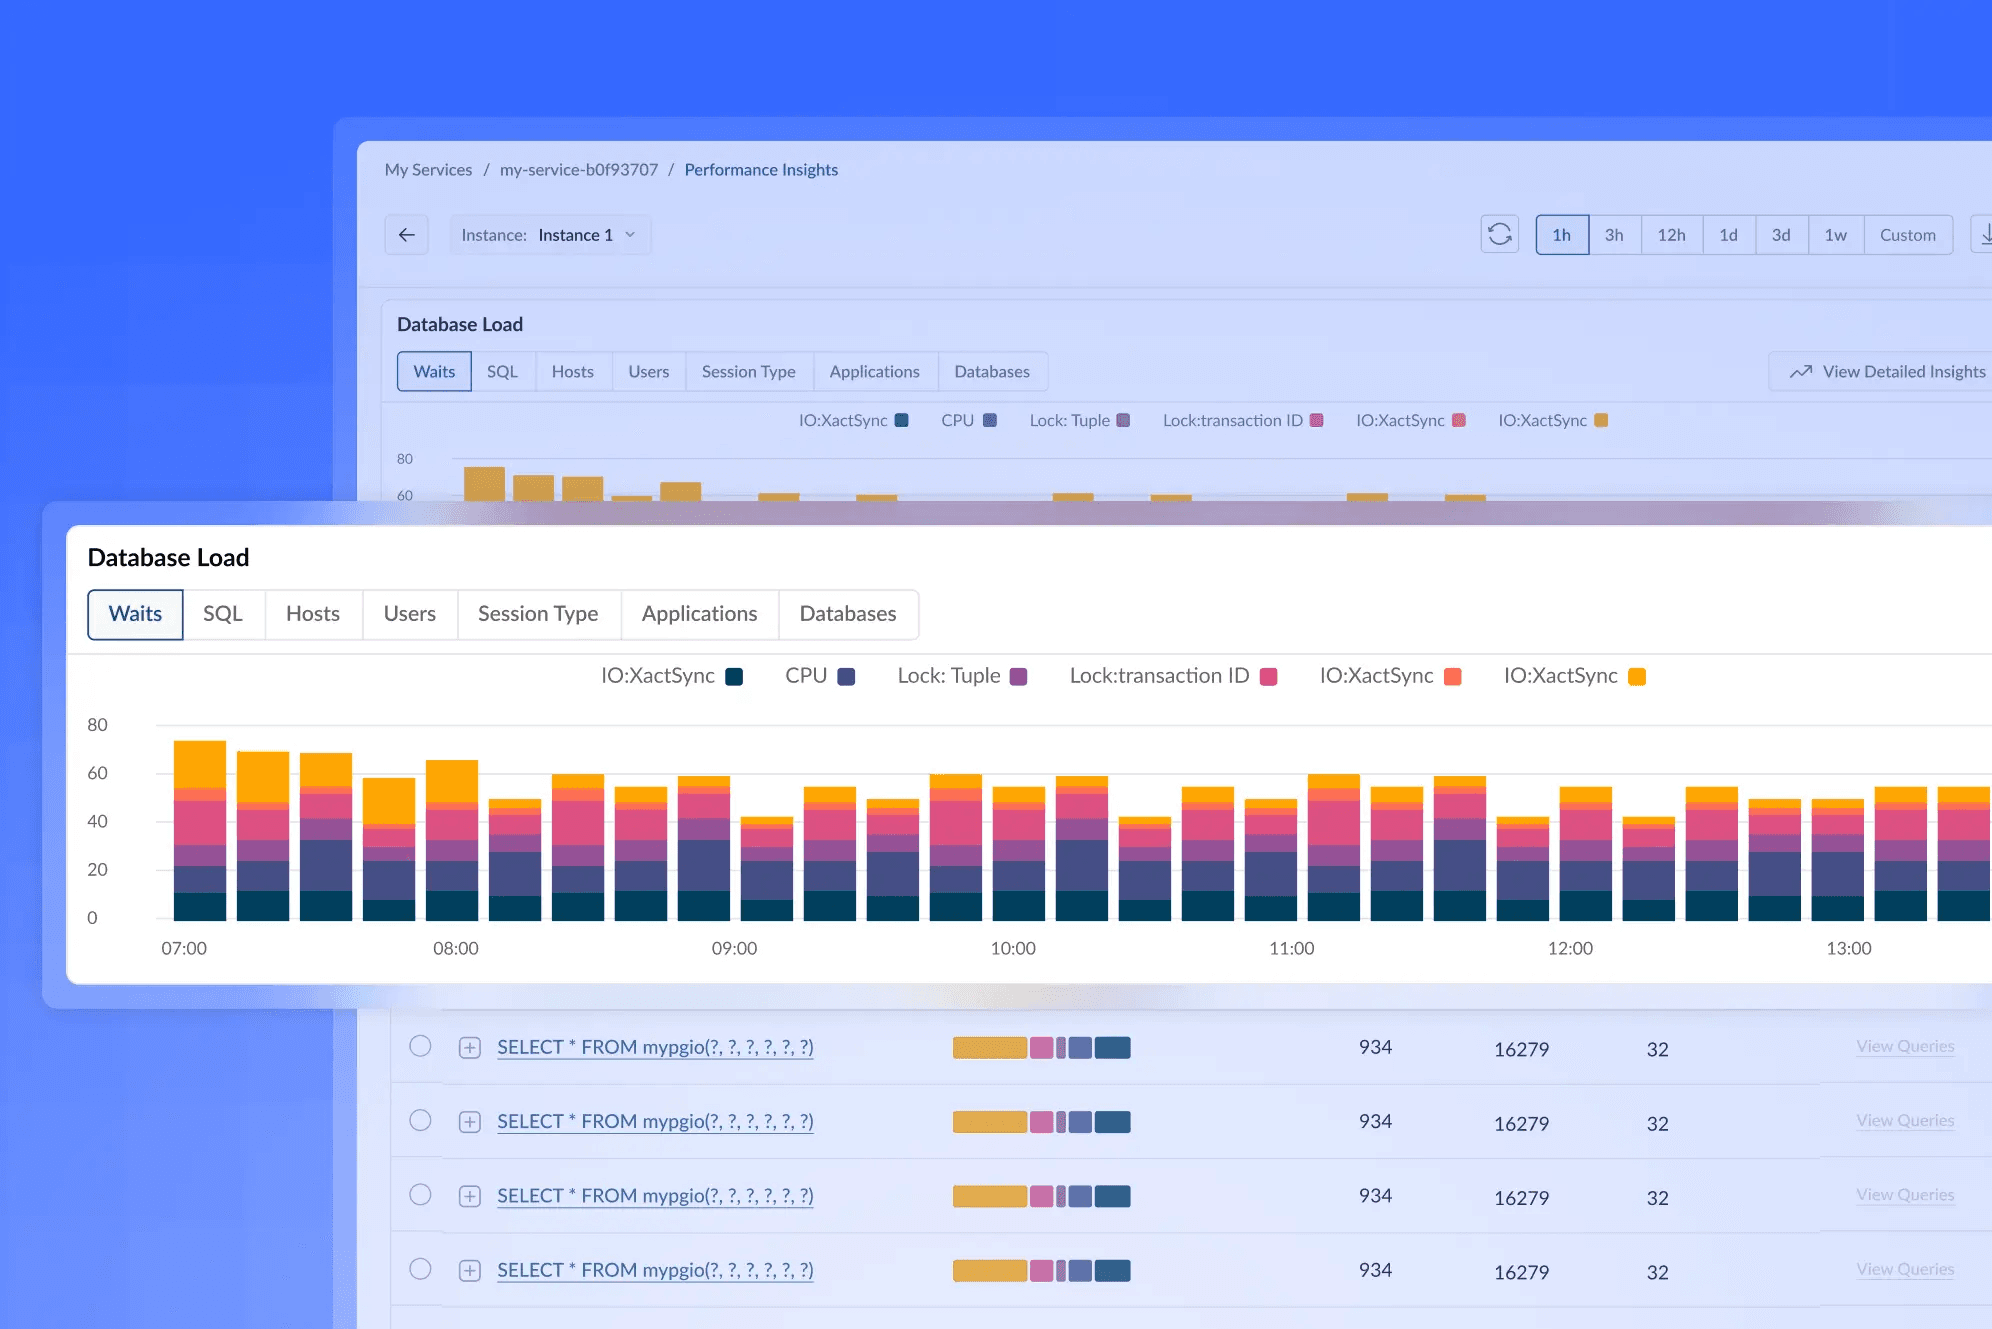
See what is driving database load, not just that it is high.
Performance Insights breaks load down to Average Active Sessions, sampled every second, so you can see how many sessions are active and what they are waiting on. Drill into the top waits, SQL statements, hosts, users, and databases behind the load across a 1-hour to 24-hour window, or a custom range, down to 5-minute detail. Enabled at provisioning or any time after.
100% observability across all workloads, a non-negotiable requirement for a HIPAA-regulated estate, met from day one.
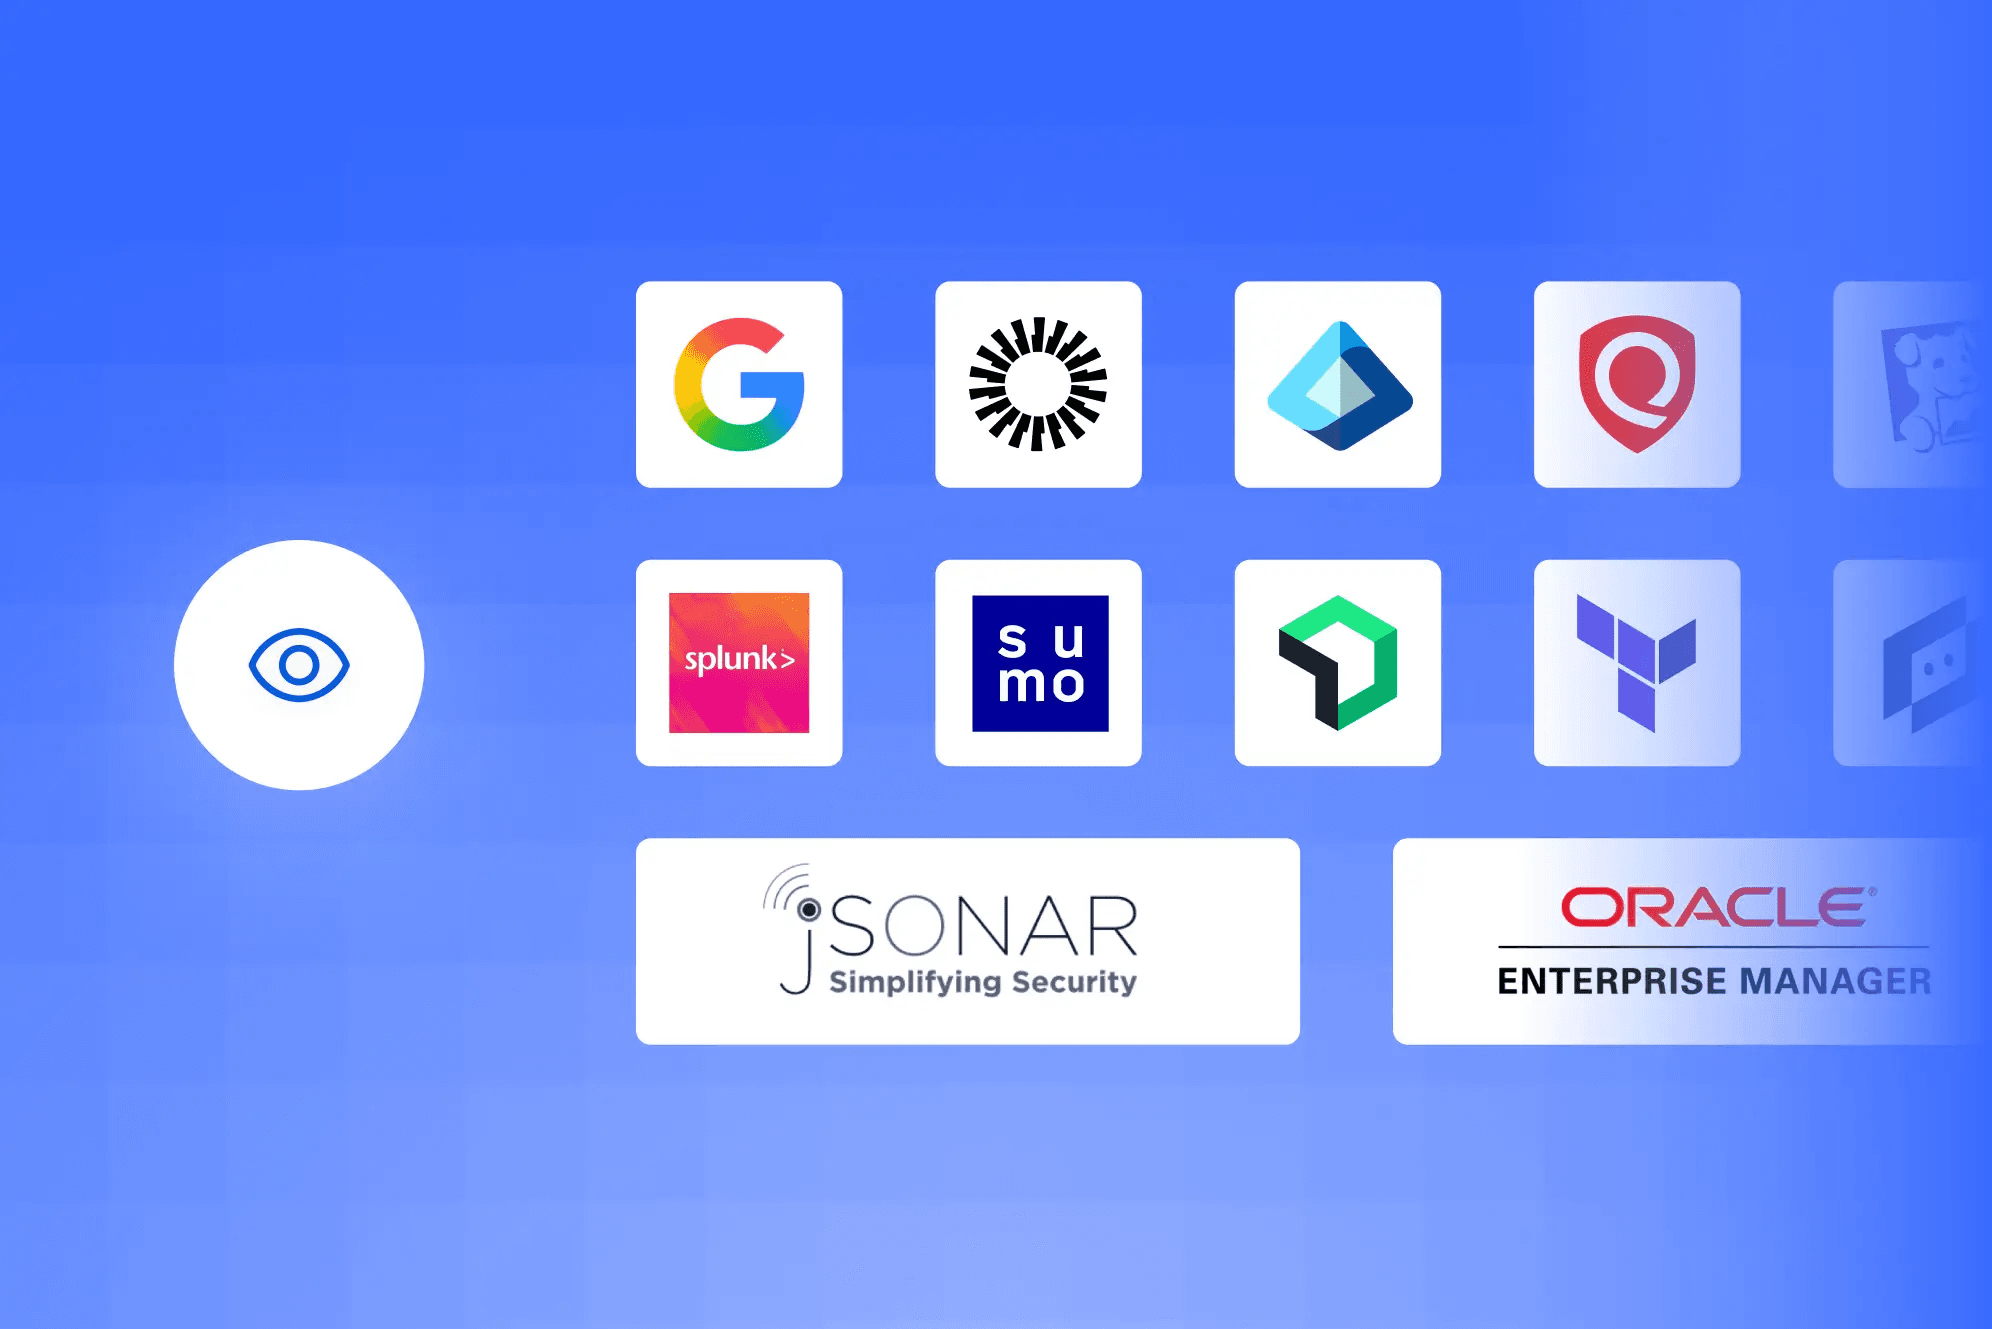
Plugs into the stack you already run.
Tessell connects to the monitoring and security tools your teams already operate rather than asking them to adopt a new one. Bring your own account for Datadog, Splunk, New Relic, Sumo Logic, Oracle Enterprise Manager, and Qualys, enabled per service, with alerting routed to Slack or email. Because the same framework carries vulnerability scanning and log management, it also supports your Security and Compliance posture.
Enterprise security and monitoring stack connected to Tessell-managed databases through the integration framework.
Monitoring is one part of the database lifecycle.
A database has to be provisioned, kept current, watched, and kept running when something goes wrong. Tessell manages the full operational lifecycle from one platform.
Every database, provisioned to the same standard, in minutes.
Monitoring is configured here, so visibility is in place before the database serves its first query.
Explore ProvisioningKeep every database current.
See the impact of a patch, upgrade, or resize in real time, on the same metrics.
Explore Lifecycle ManagementKeep it running when something goes wrong.
Watch replica health and replication state alongside primary metrics.
Explore Business ContinuitySee the observability layer in your own environment.
Walk through the infrastructure metrics, Performance Insights, and your integrations with a Tessell engineer, using your engines, your cloud, and the monitoring tools you already run.